Measuring the wind speed with the Raspberry Pi using the PiLogger is very easy.
The PiLogger provides a special input which is compatible with a lot of valuable wind sensors. Those sensors have in common to output pulses. This also is true for many other 'rate' sensors, for instance flow meters (e.g. for water) or turn speed meters.
The PiLogger is equipped with a pulse count input which is designed for the direct connection of sensors with Reed contacts (magnetically operated mechanical switches) or OC (Open Collector) or OD (Open Drain). With this Reed contacts provide the advantage not to need additional sensor power supply, while those switches are optimally protected in a little glass tube - so they will work properly for a very long time.
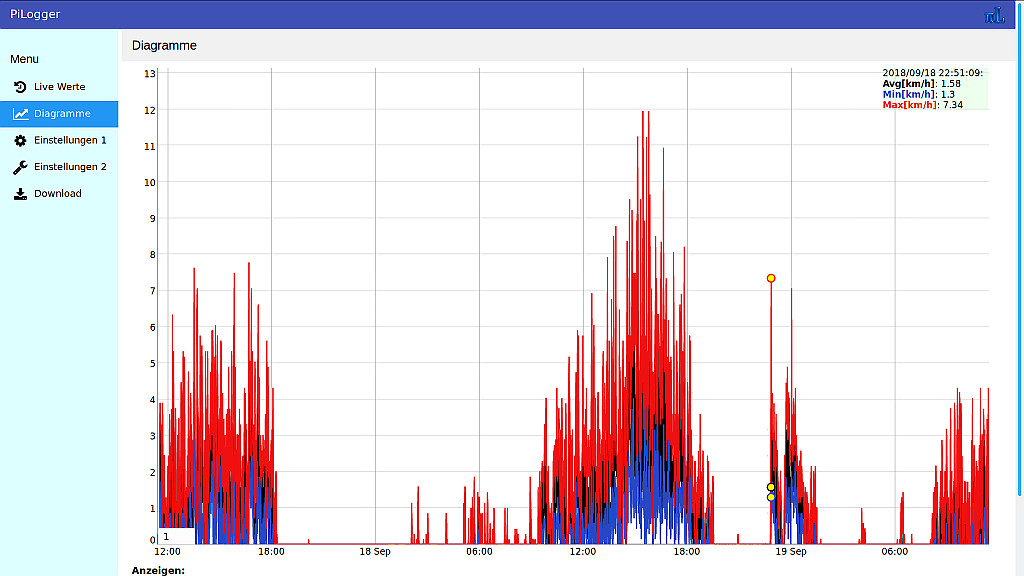
Here for example a screen shot from the PiLogger WebMonitor software :
For a good accuracy on wind speed measurement a so called cup anemometer is a good choice. Their pulse rate is quite good proportional to the actual wind speed within a reasonable range. This means you just have to multiply the pulse rate with the individual sensor constant, which is travelling length per pulse.
New : Build your own wind speed sensor with our building kit 'PiLogger DIY Anemometer'

Connecting the Sensor
Connecting the wind speed sensor to the PiLogger is as easy as can be. Just push the to wire ends into the both screw terminals at the right middle, labeled 'Imp' and 'GND' and fasten them by the screws. For the Reed contact sensor type it doesn't matter which wire is connected to what terminal, but for sensors with OC or OD output the respective wire has to be connected to 'Imp'.

Together this will look like this:

Measurement and Logging
In case the base software for the PiLogger, which is available in the download section, is already installed to the Raspberry (see manual), you now just have to start this software to check the function of the sensor. In the monitor window you can watch the wind speed values live. Just test the reaction on blowing to the sensor or spinning it by hand. You also can do all necessary settings at the PiLogger for your logging task by this software.

Web-Monitor Software
With the PiLogger WebMonitor Software you can view live measurement data and charts fast and easy. The complete control and data management can be done comfortable via WiFi in your home network from any device having a web browser. Here is a screenshot of a wind speed chart on an android tablet:

Concept of Operation
The measurement of wind speed is done here by counting the pulse produced by the sensor within a given time interval - the logging interval. For that purpose the PiLogger is equipped with a 16 bit counter.
The measurement is performed periodically with the given time interval. This interval can be set in the range between 0,1 seconds and more than 18 hours. Usually this counter is reseted at every completed measurement. But for the case the other measurement channels require a to short time interval to derive a reasonable gating time for low wind speeds, there is an option to set the time interval for pulse counting to a multiple of the regular logging interval.
After each completed measurement the PiLogger signals the Raspberry that new measurement values can be retrieved. The software running on the Raspberry takes over the task to calculate the measurement values from the raw data and any desired post processing as well as storing the results. Storing can be done either directly to the SD card or for instance by sending via WiFi to a remote computer.
Buy the PiLogger

")