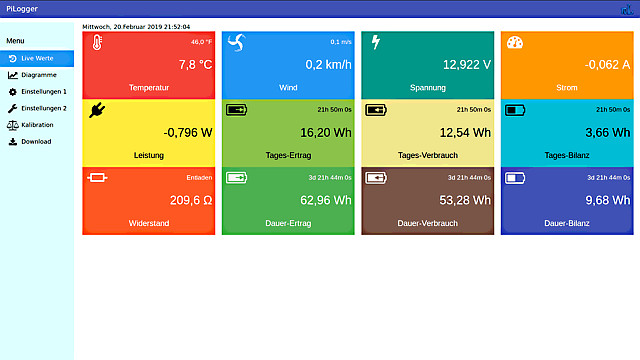
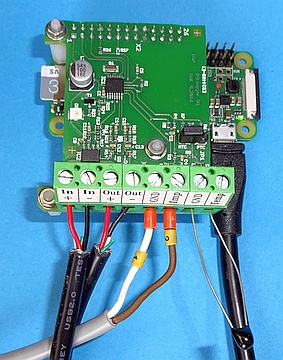
PiLogger WebMonitor is free of charge and free open source software, it runs on the Raspberry Pi enabling monitoring and logging with the PiLogger One via the network - without cloud and foreign servers.
PiLogger WebMonitor turns the Raspberry Pi into a small web server, which is accessible via the home network. By that any device which is connected to your home network can display the recent values, show charts of the time line, download the data logs and control all settings just by using a browser.
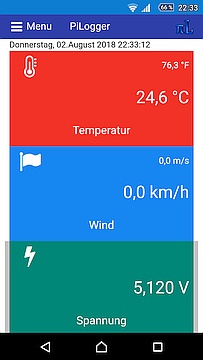
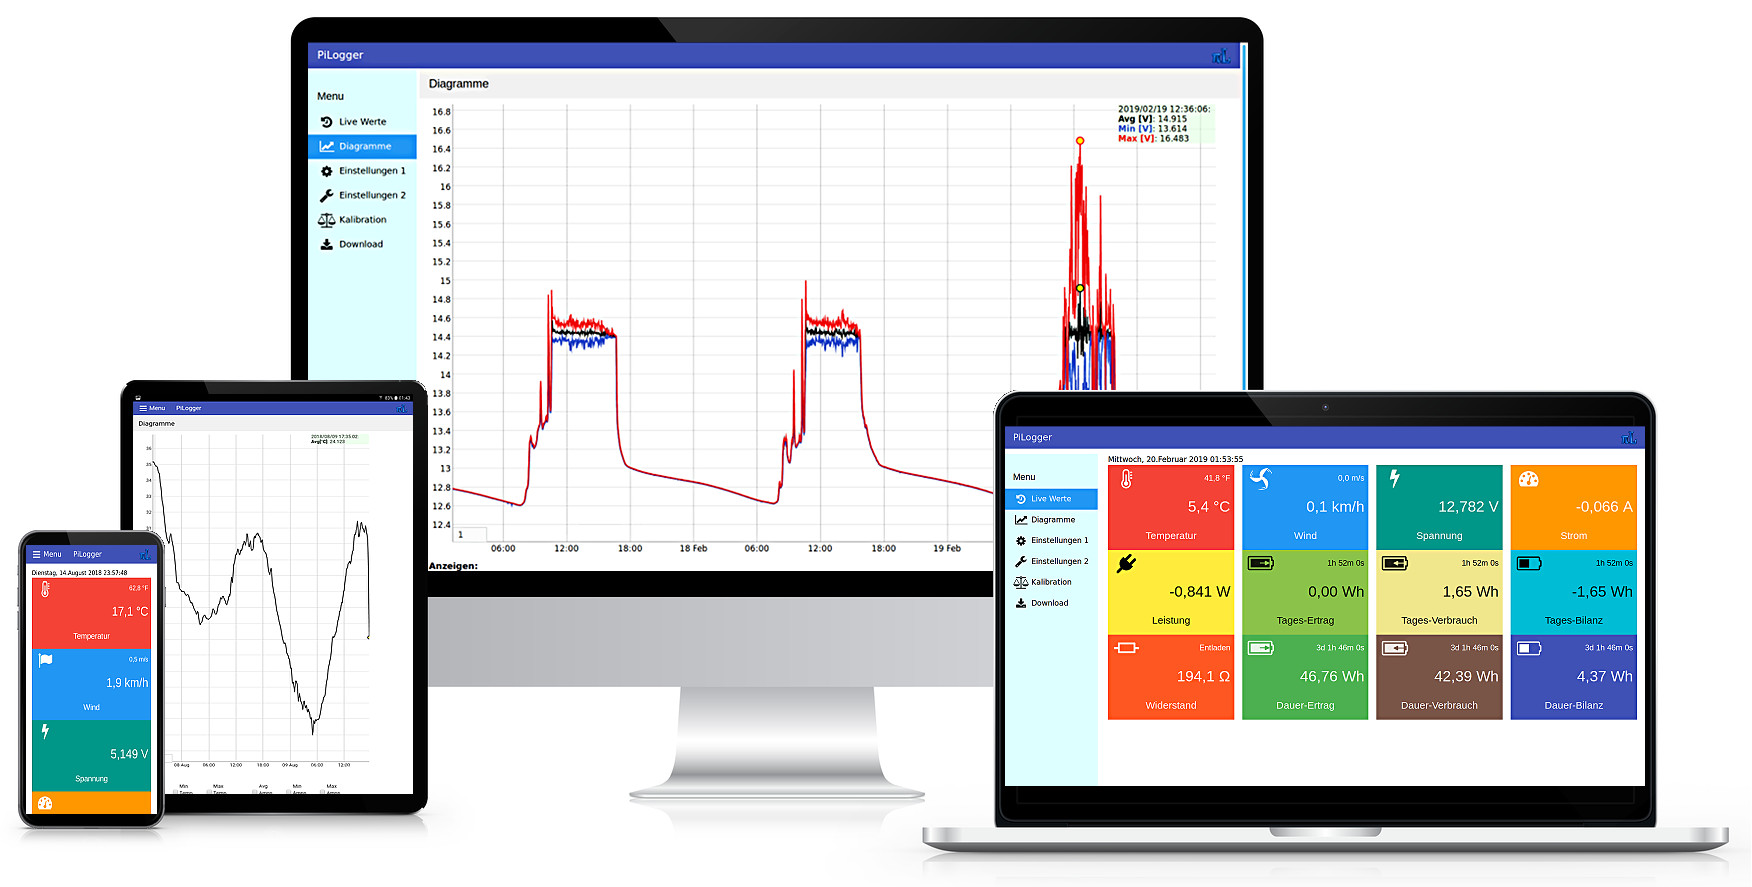
The design is 'responsive' , so the presentation is adapted to the actual display size. For example the live value page:


Requirements
The software is meant for a Raspberry Pi running Raspbian Lite (Stretch) without display and keyboard, but connected to the network. With respect to the energy consumption the best choice is a Raspberry Pi Zero W, because it comes with a single core processor, having a lower current consumption and additionally has a smart WiFi module integrated. For setting up such a 'headless' system with WiFi connection active you will find a step by step guide here (german up to now) : Anleitung.
Actually required are just Raspbian with python 3 and an active network connection and of course a PiLogger One. Effectively it can be installed on a full blown desktop Raspbian too, allowing local operation by for instance the chromium browser.
Installation
If your system is prepared in that way you can perform the installation just with this single command line in your ssh attached console (for this an active internet connection is needed) :
curl -sSL https://www.pilogger.de/get/installer-webmon | bashBy this command line a shell script is downloaded from our server and than executed. The script can be downloaded separately in the download section to be inspected by means of any text editor. The installer script performs all necessary configurations and needed installations. In the course of that also the application files will be downloaded packed in an archive file. This archive file also can be downloaded separately in the download section.
To start the web application after a successful installation just write the IP adress of the PiLogger to the input field of your browser and append the port :8080 , so for example input '192.168.178.21:8080'. When installed on a full desktop Raspbian invoking is done with 127.0.0.1:8080 . After successfully invoking the start page you can simply add a favorite link to your browser with a meaningful name like 'PiLogger WebMonitor'.
Concept
PiLogger WebMonitor aims for two targets : effectiveness and privacy. This means for instance only lean frameworks and only actually needed ones. On the other hand there will be no contacts to internet servers after completing the installation, all traffic shall stay in your own private network.
On the Raspberry a small and lean web server is run. For that PiLogger WebMonitor is based on the python web framework bottle by Marcel Hellkamp. Because of this the main application is written as an python 3 script. To communicate with the PiLogger One via I²C the python module 'smbus' is used. To enable working with interrupt line of the PiLogger the python module 'rpi.gpio' is used. So the internal clock of the PiLogger One is used to time the measurement intervals. The time stamps for the measurement values are added by the Raspberry. For this purpose it synchronises its system time via NTP. Normally for it contacts an internet server for that, but for the sake of a private system without external connections this synchronisation can be achieved with the own internet router in most cases. Most of those routers can be configured to provide a NTP service for the internal network. This service can be used by the Raspberry then, so its just only contacting the router. This option can be chosen at installation time with the installer script.
The built in server of Bottle serves the HTML files for showing the pages with a browser on the client side. To reduce the count of server requests the needed java scripts are directly embedded in the HTML files. There is no loading of external resources like web fonts (typically from Google). Only the CSS files are requested separately from the Raspberry.
The browser requests the measurement data via XHR (AJAX) and then presents them with the HTML design. The charts are also generated completely by the client side browser. In this case the data are downloaded as a CSV file and processed by the javascript library Dygraphs and finally rendered to a canvas element within the page.
PiLogger WebMonitor does not use a database to store the measurement values. The data are simply stored to CSV files. The number of data points (lines) per file can be configured. The data file are stored on the SD card of the Raspberry and can be downloaded simply to the client computer. On that computer for instance further processing by a spread sheet application can be done easily.


